Implementating the tool in a Shiny application
Considerations
The previous chapters have described the analytical process taken to determine the most accurate model for each of the outcome variables. Table 1 describes the variety of the modelling inputs and approaches taken to determine which combination results in the best performing outcomes. Table 2 describes the best models as determined by the MAPE evaluation method.
To make the outputs accessible to a wide audience, a Shiny application was developed. The tool contains the model objects which are the outputs of this analytical exercise. The user of the tool is able to manipulate the inputs to see how they affect the predicted outputs for each of the outcomes.
Some additional considerations were made before providing the models to the user via the Shiny application:
- do the important variables make sense hypothetically?
- are there any obvious issues with future predictions?
- do the future predictions respond as expected when the inputs are altered?
It is intended that the tool provides the user with a believable experience. The model that has historically been the most accurate at predicting the outcome may be doing so using relationships that are unintuitive. For a user, if this was the case, it could deter them from using the tool. As modelling performance was so similar between the top performing models, it allowed some decision making over which models to surface through the tool. We ensured that only models were surfaced where the majority of the predictor variables, with respect to the outcome, made sense.
Generally, the best performing models were the random forest models that predict the change in performance from one year to the next. There are no constraints on random forest predictions, and providing these within the tool could result in predictions for the outcome to be outside of the 0-100% constraints that a proportion outcome provides. In the short term (1-10 years) this is unlikely, but it is still possible. Therefore, these random forest models were not surfaced in the tool.
The models that were based on the generalised linear modelling approach that contained the previous year’s value as a predictor variable often performed very well. Using last year’s value to anchor the prediction seemed like a good approach. Unfortunately, when last year’s value was an important variable, it had the effect of being unable to reverse the direction of consecutive predictions, often causing the prediction of the outcome to exponentially increase to 100% within a few years. These models were therefore not included.
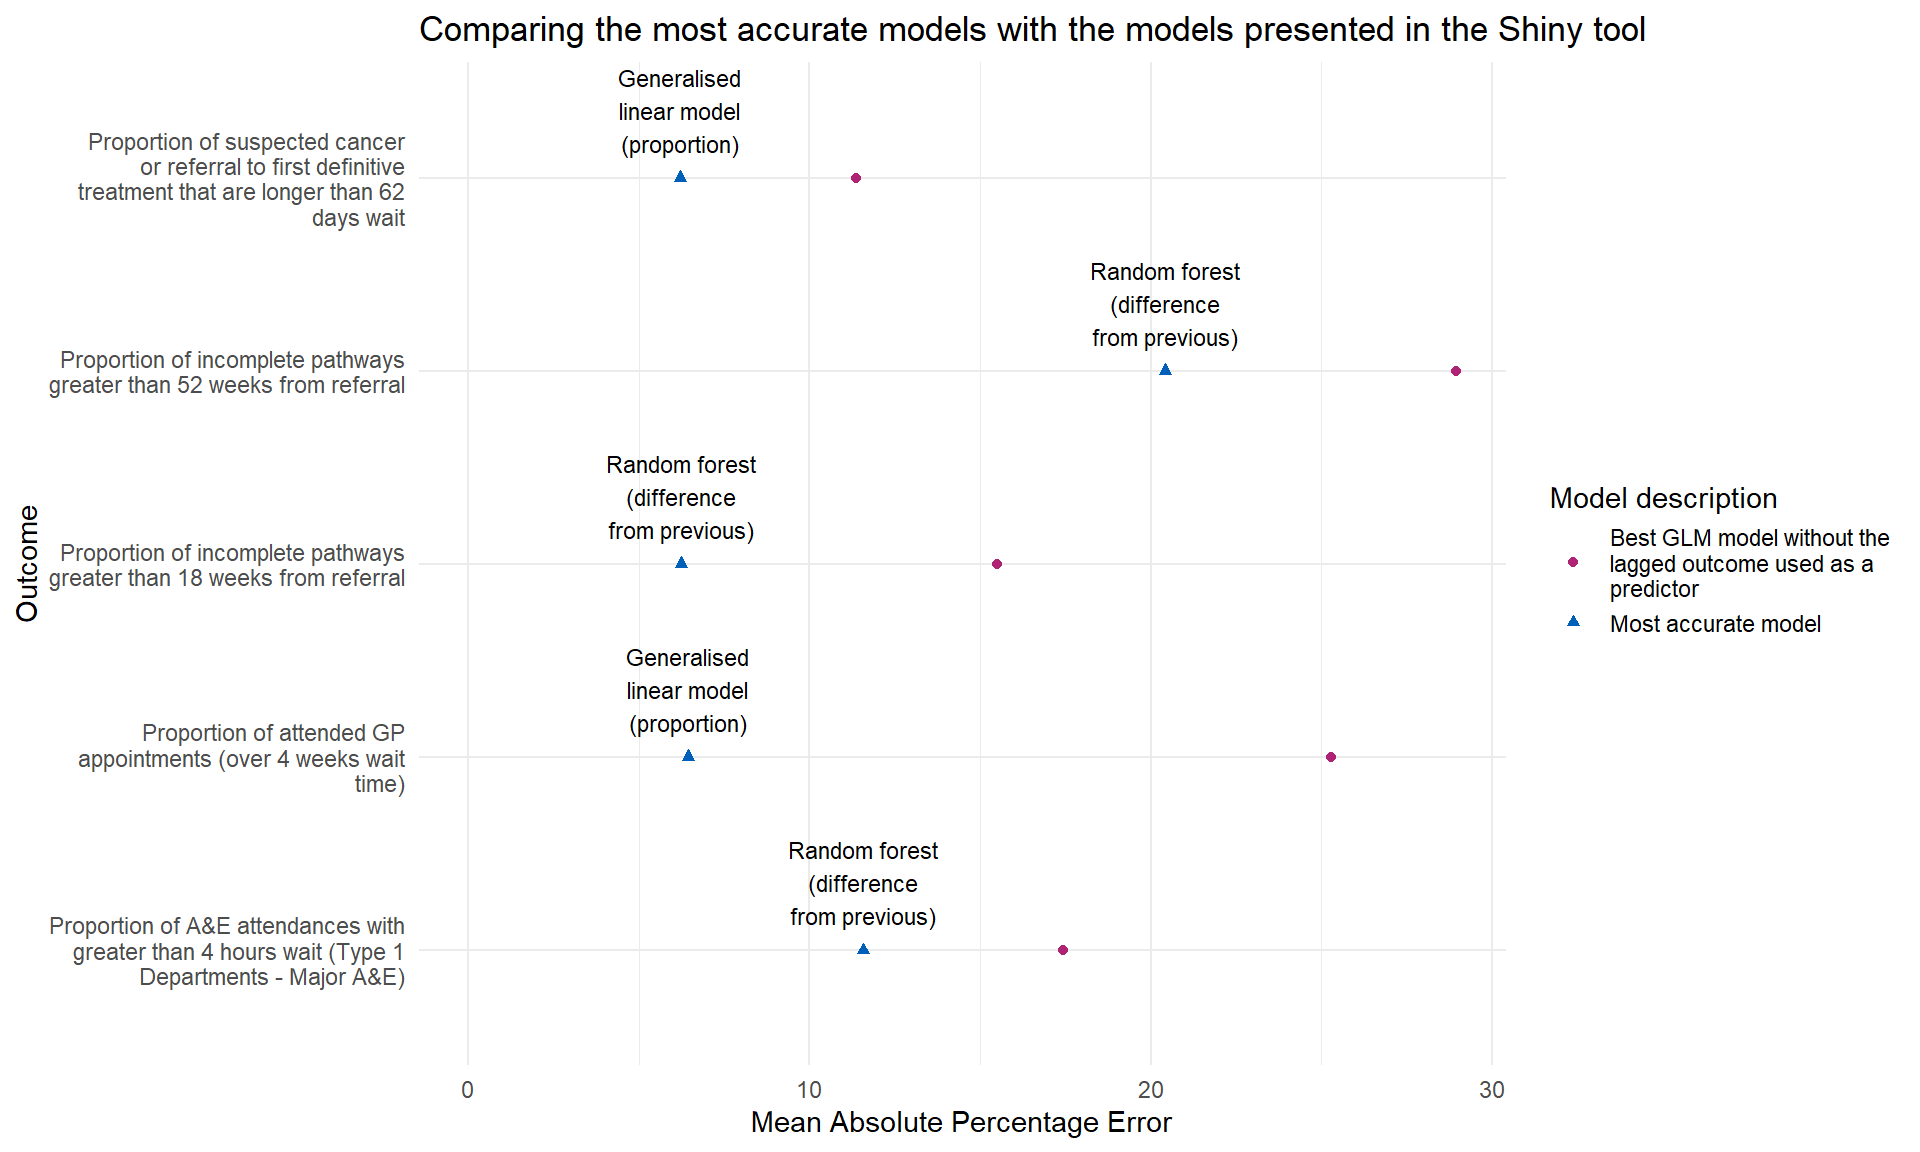
This has resulted in only presenting the generalised linear models through the Shiny application, where the target variable is not used as a predictor variable. Figure 1 shows how the models presented in the Shiny application compare with the best performing models.