Description
Data description
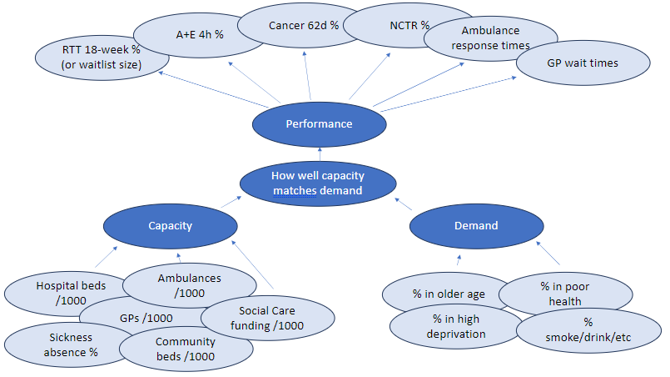
An approximate model of how demand and capacity metrics can be seen below:
Data definitions
The metrics collated for the project are presented in the tabs below. for a fuller description, see Modelling inputs:
| Theme | Metric |
|---|---|
| Acute beds | Proportion of available beds that are occupied (General & Acute - day) |
| Acute beds | Proportion of available beds that are occupied (General & Acute - overnight) |
| Acute beds | Proportion of available beds that are occupied (Maternity - overnight) |
| Acute beds | Proportion of available beds that are occupied (Mental Illness - overnight) |
| Acute beds | Total beds per 1,000 60+ yrs (General & Acute - overnight) |
| COVID19 | Mean proportion of beds that contain a patient with confirmed COVID |
| Finanace and use of resources | A and E and Ward Liaison mental health services spend (£k) per population |
| Finanace and use of resources | Adult community crisis care spend (£k) per population |
| Finanace and use of resources | Children and Young People Mental Health spend - eating disorders per population |
| Finanace and use of resources | Children and Young People Mental Health spend - excluding learning disabilities and eating disorders per population |
| Finanace and use of resources | Early Intervention in Psychosis spend (£k) per population |
| Finanace and use of resources | Improving Access to Psychological Therapies spend (£k) per population |
| Finanace and use of resources | Mental Health total spend per population |
| Finanace and use of resources | Mental health spend as a proportion of overall allocation |
| People | A and E Full Time Equivalent (FTE) for Care Providers (per 100,000 population) |
| People | A and E Full Time Equivalent (FTE) for Consultants (per 100,000 population) |
| People | A and E Full Time Equivalent (FTE) for Doctors (excluding Consultants) (per 100,000 population) |
| People | A and E Full Time Equivalent (FTE) for Nurses (per 100,000 population) |
| People | FTE days available per 100 population (acute) |
| People | FTE days available per 100 population (mental health) |
| People | FTE days sick per 10,000 population (acute) |
| People | FTE days sick per 10,000 population (mental health) |
| People | Primary care workforce (FTEs) per 100,000 population (Admin/Non-Clinical) |
| People | Primary care workforce (FTEs) per 100,000 population (Direct Patient Care) |
| People | Primary care workforce (FTEs) per 100,000 population (GP) |
| People | Primary care workforce (FTEs) per 100,000 population (Nurses) |
| People | Workforce FTEs per 100,000 population (Total - Acute) |
| Theme | Metric |
|---|---|
| Population | Proportion of population in age band (0-29) |
| Population | Proportion of population in age band (0-9) |
| Population | Proportion of population in age band (10-19) |
| Population | Proportion of population in age band (20-29) |
| Population | Proportion of population in age band (30-39) |
| Population | Proportion of population in age band (30-59) |
| Population | Proportion of population in age band (40-49) |
| Population | Proportion of population in age band (50-59) |
| Population | Proportion of population in age band (60+) |
| Population | Proportion of population in age band (60-69) |
| Population | Proportion of population in age band (70-79) |
| Population | Proportion of population in age band (80+) |
| Risk factors | % active smokers (GPPS) |
| Risk factors | Asthma: QOF prevalence (all ages) |
| Risk factors | Atrial fibrillation: QOF prevalence (all ages) |
| Risk factors | CHD: QOF prevalence (all ages) |
| Risk factors | CKD: QOF prevalence (18+ yrs) |
| Risk factors | COPD: QOF prevalence (all ages) |
| Risk factors | Cancer: QOF prevalence (all ages) |
| Risk factors | Dementia: QOF prevalence (all ages) |
| Risk factors | Diabetes mellitus: QOF prevalence (17+ yrs) |
| Risk factors | Epilepsy: QOF prevalence (18+ yrs) |
| Risk factors | Heart failure: QOF prevalence (all ages) |
| Risk factors | Hypertension: QOF prevalence (all ages) |
| Risk factors | Obesity: QOF prevalence (18+ yrs) |
| Risk factors | Osteoporosis: QOF prevalence (50+ yrs) |
| Risk factors | Palliative care: QOF prevalence (all ages) |
| Risk factors | Peripheral arterial disease: QOF prevalence (all ages) |
| Risk factors | Proportion of resident population in national deprivation quintile (Least deprived quintile) - IMD 2019 |
| Risk factors | Proportion of resident population in national deprivation quintile (Most deprived) - IMD 2019 |
| Risk factors | Rheumatoid arthritis: QOF prevalence (16+ yrs) |
| Risk factors | Stroke and transient ischaemic attack: QOF prevalence (all ages) |
| Theme | Metric |
|---|---|
| Quality of care, access and outcomes | Proportion of A&E attendances with greater than 4 hours wait (Type 1 Departments - Major A&E) |
| Quality of care, access and outcomes | Proportion of attended GP appointments (over 4 weeks wait time) |
| Quality of care, access and outcomes | Proportion of incomplete pathways greater than 18 weeks from referral |
| Quality of care, access and outcomes | Proportion of incomplete pathways greater than 52 weeks from referral |
| Quality of care, access and outcomes | Proportion of suspected cancer or referral to first definitive treatment that are longer than 62 days wait |
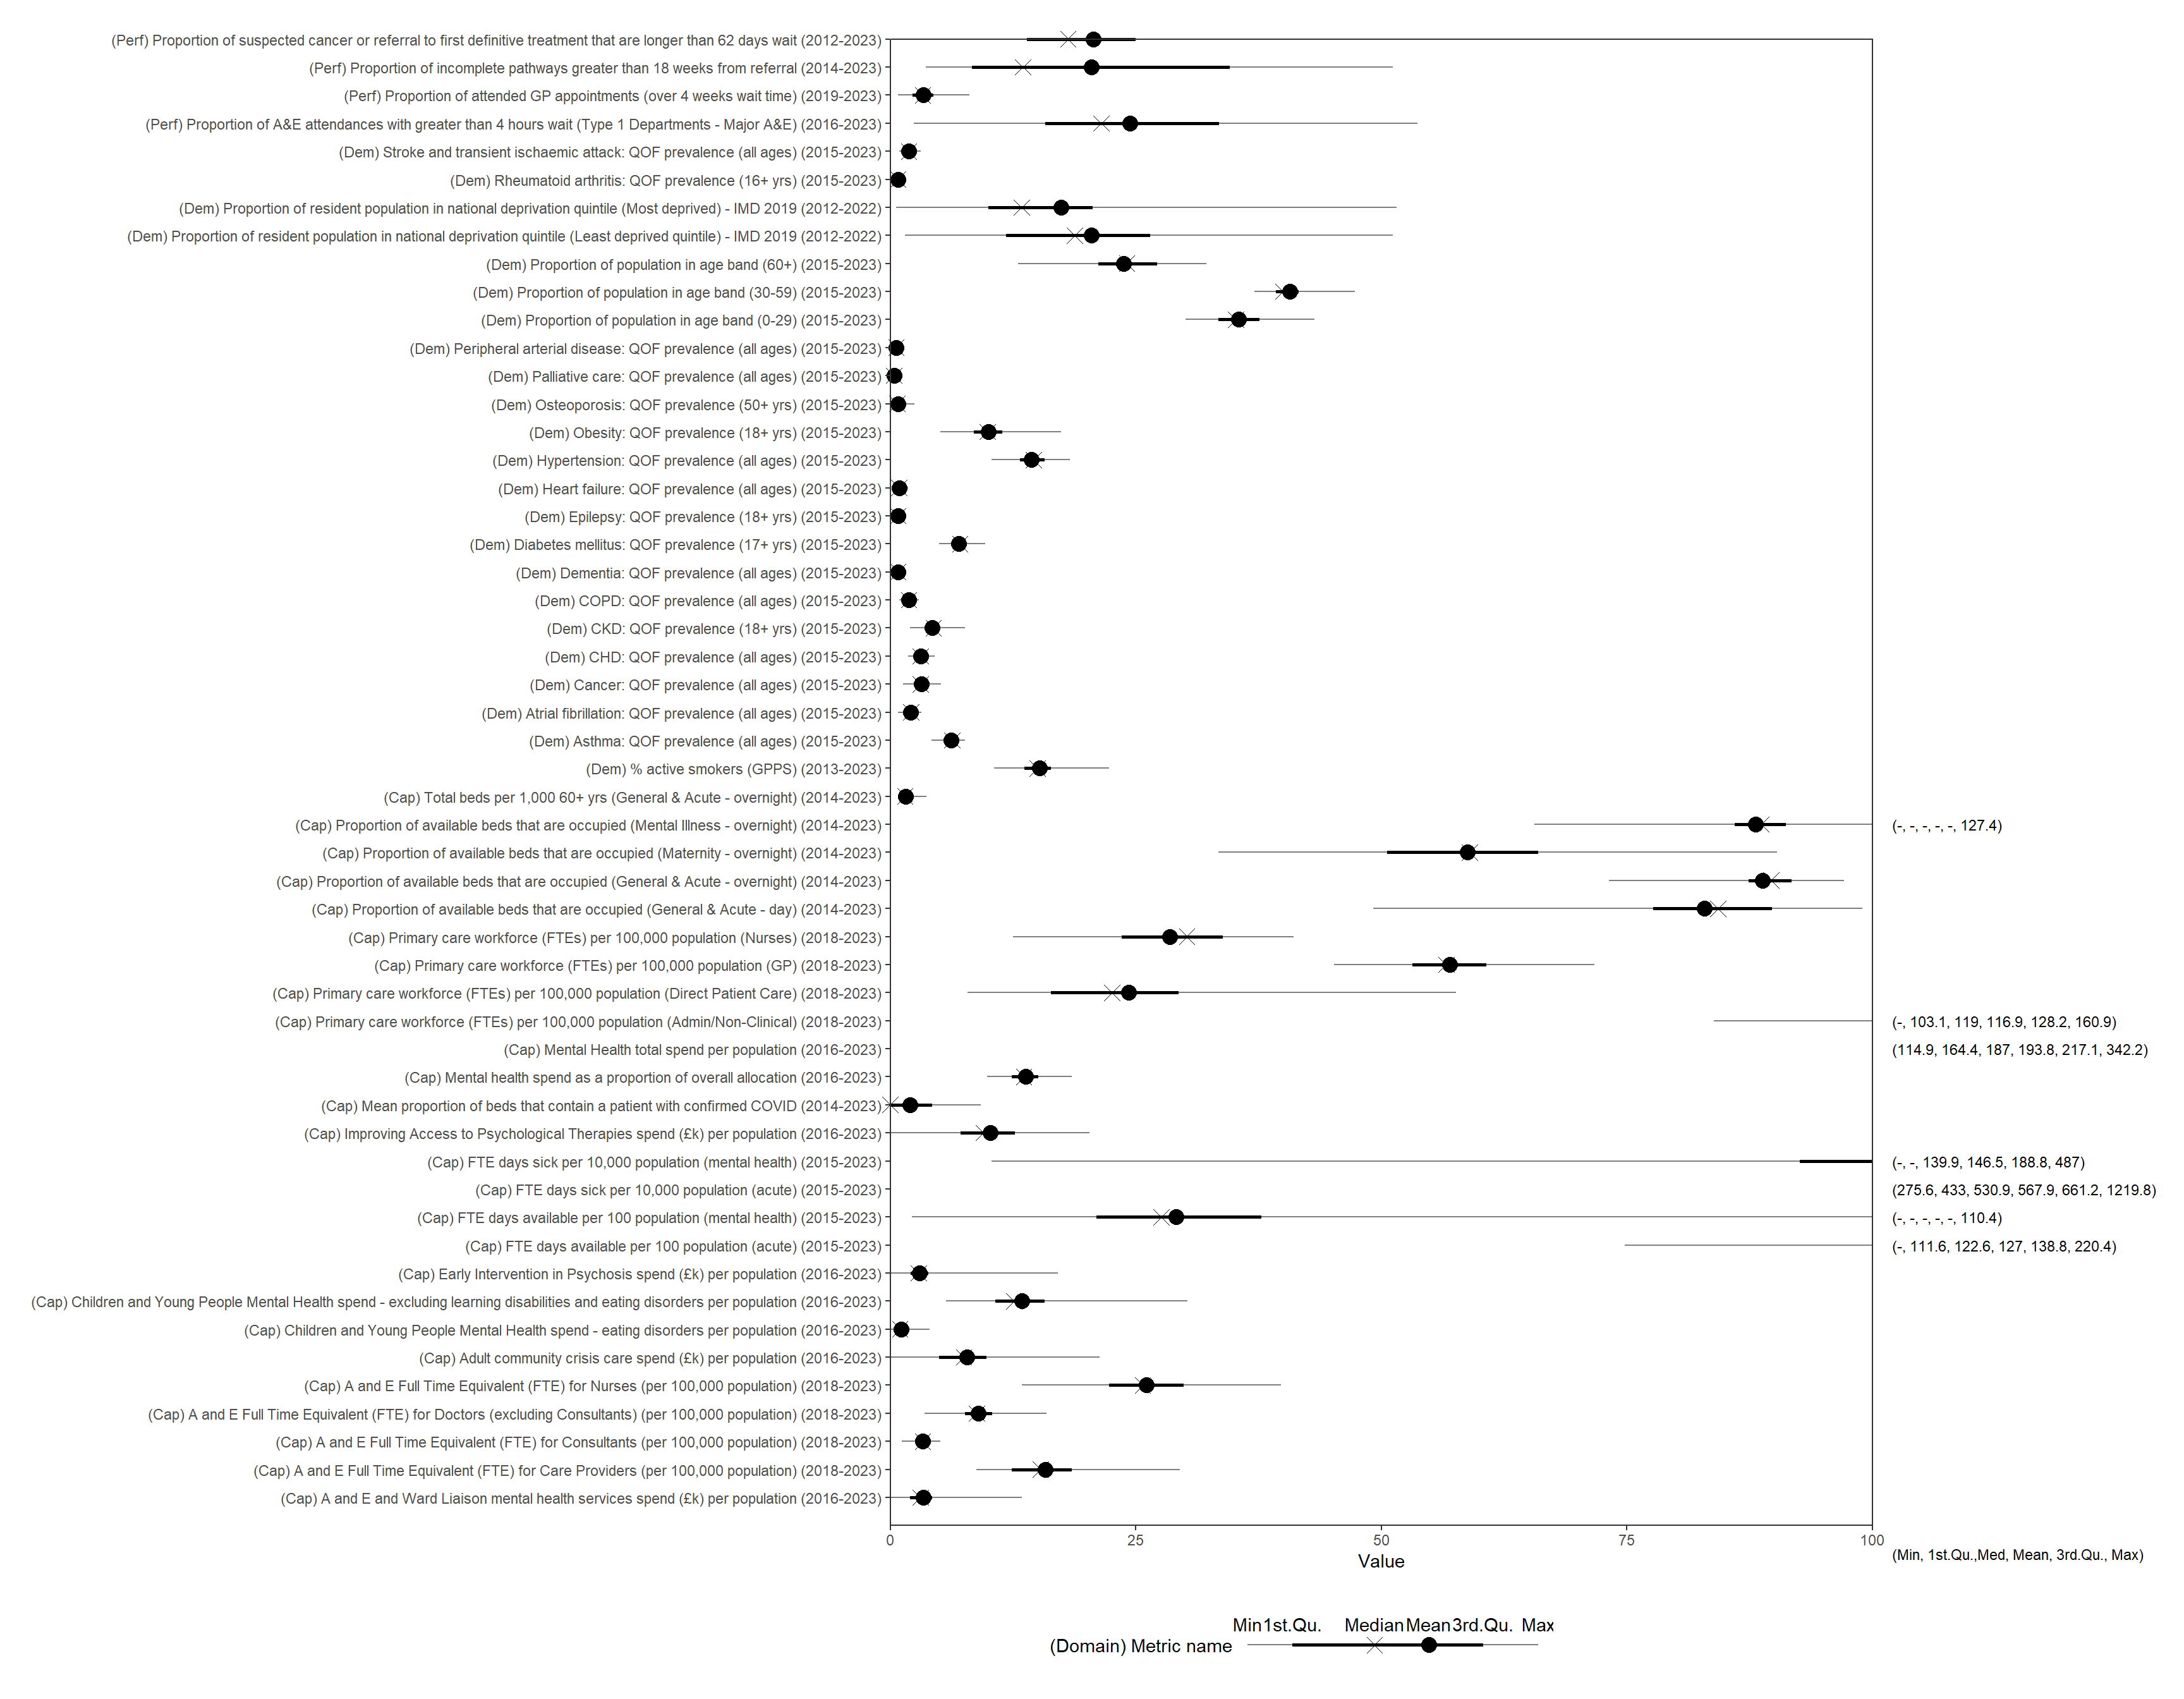
Data summary
The frequencies these metrics have been collected at are displayed below: